Amazon Fashion Sales Analysis
January 2025 Performance Review & February Growth Strategy
January 2025 Performance Review & February Growth Strategy
This report presents a comprehensive analysis of Amazon Fashion Sales data from January 2025. The analysis reveals key trends, patterns, and opportunities that can be leveraged to achieve a 10% sales growth target for February 2025.
Based on our analysis, we've identified several key opportunities to boost February sales by 10%, which would increase gross sales to approximately $182,386. Our recommendations focus on optimizing sales on high-performing days, improving conversion rates, and implementing targeted promotional strategies.
This analysis is based on Amazon Fashion Sales data from January 2025, covering all product categories, sales channels, and customer segments.
| Metric | Value |
|---|---|
| Total Orders | 1,213 |
| Total Customers | 1,211 |
| Total Units Sold | 3,137 |
| Total Gross Sales | $165,805.39 |
| Total Net Profit | $56,902.39 |
| Average Daily Orders | 39.13 |
| Average Order Value | $136.11 |
| Average Units Per Order | 2.57 |
| Average Profit Margin | 34.11% |
The analysis methodology included data cleaning, exploratory data analysis, statistical analysis, and visualization to identify patterns and trends. The data was processed using Python with pandas, matplotlib, and seaborn libraries for analysis and visualization.
This report includes multiple visualizations and tables to illustrate key findings and support data-driven recommendations.
Our analysis of January 2025 Amazon Fashion Sales data revealed several important insights that can inform strategic decisions for February.
Daily gross sales fluctuated throughout January, with notable peaks on January 3rd, 6th, 14th, 17th, and 21st.
Friday and Tuesday show the highest average gross sales, while Sunday and Monday have the lowest performance.
Profit margins fluctuated between 28% and 40% throughout January, with an average of 34.1%.
Average Order Value (AOV) fluctuated between $125 and $152, while Units Per Order remained relatively stable.
January 14 with $11,752.01 in sales
January 23 with $2,743.56 in sales
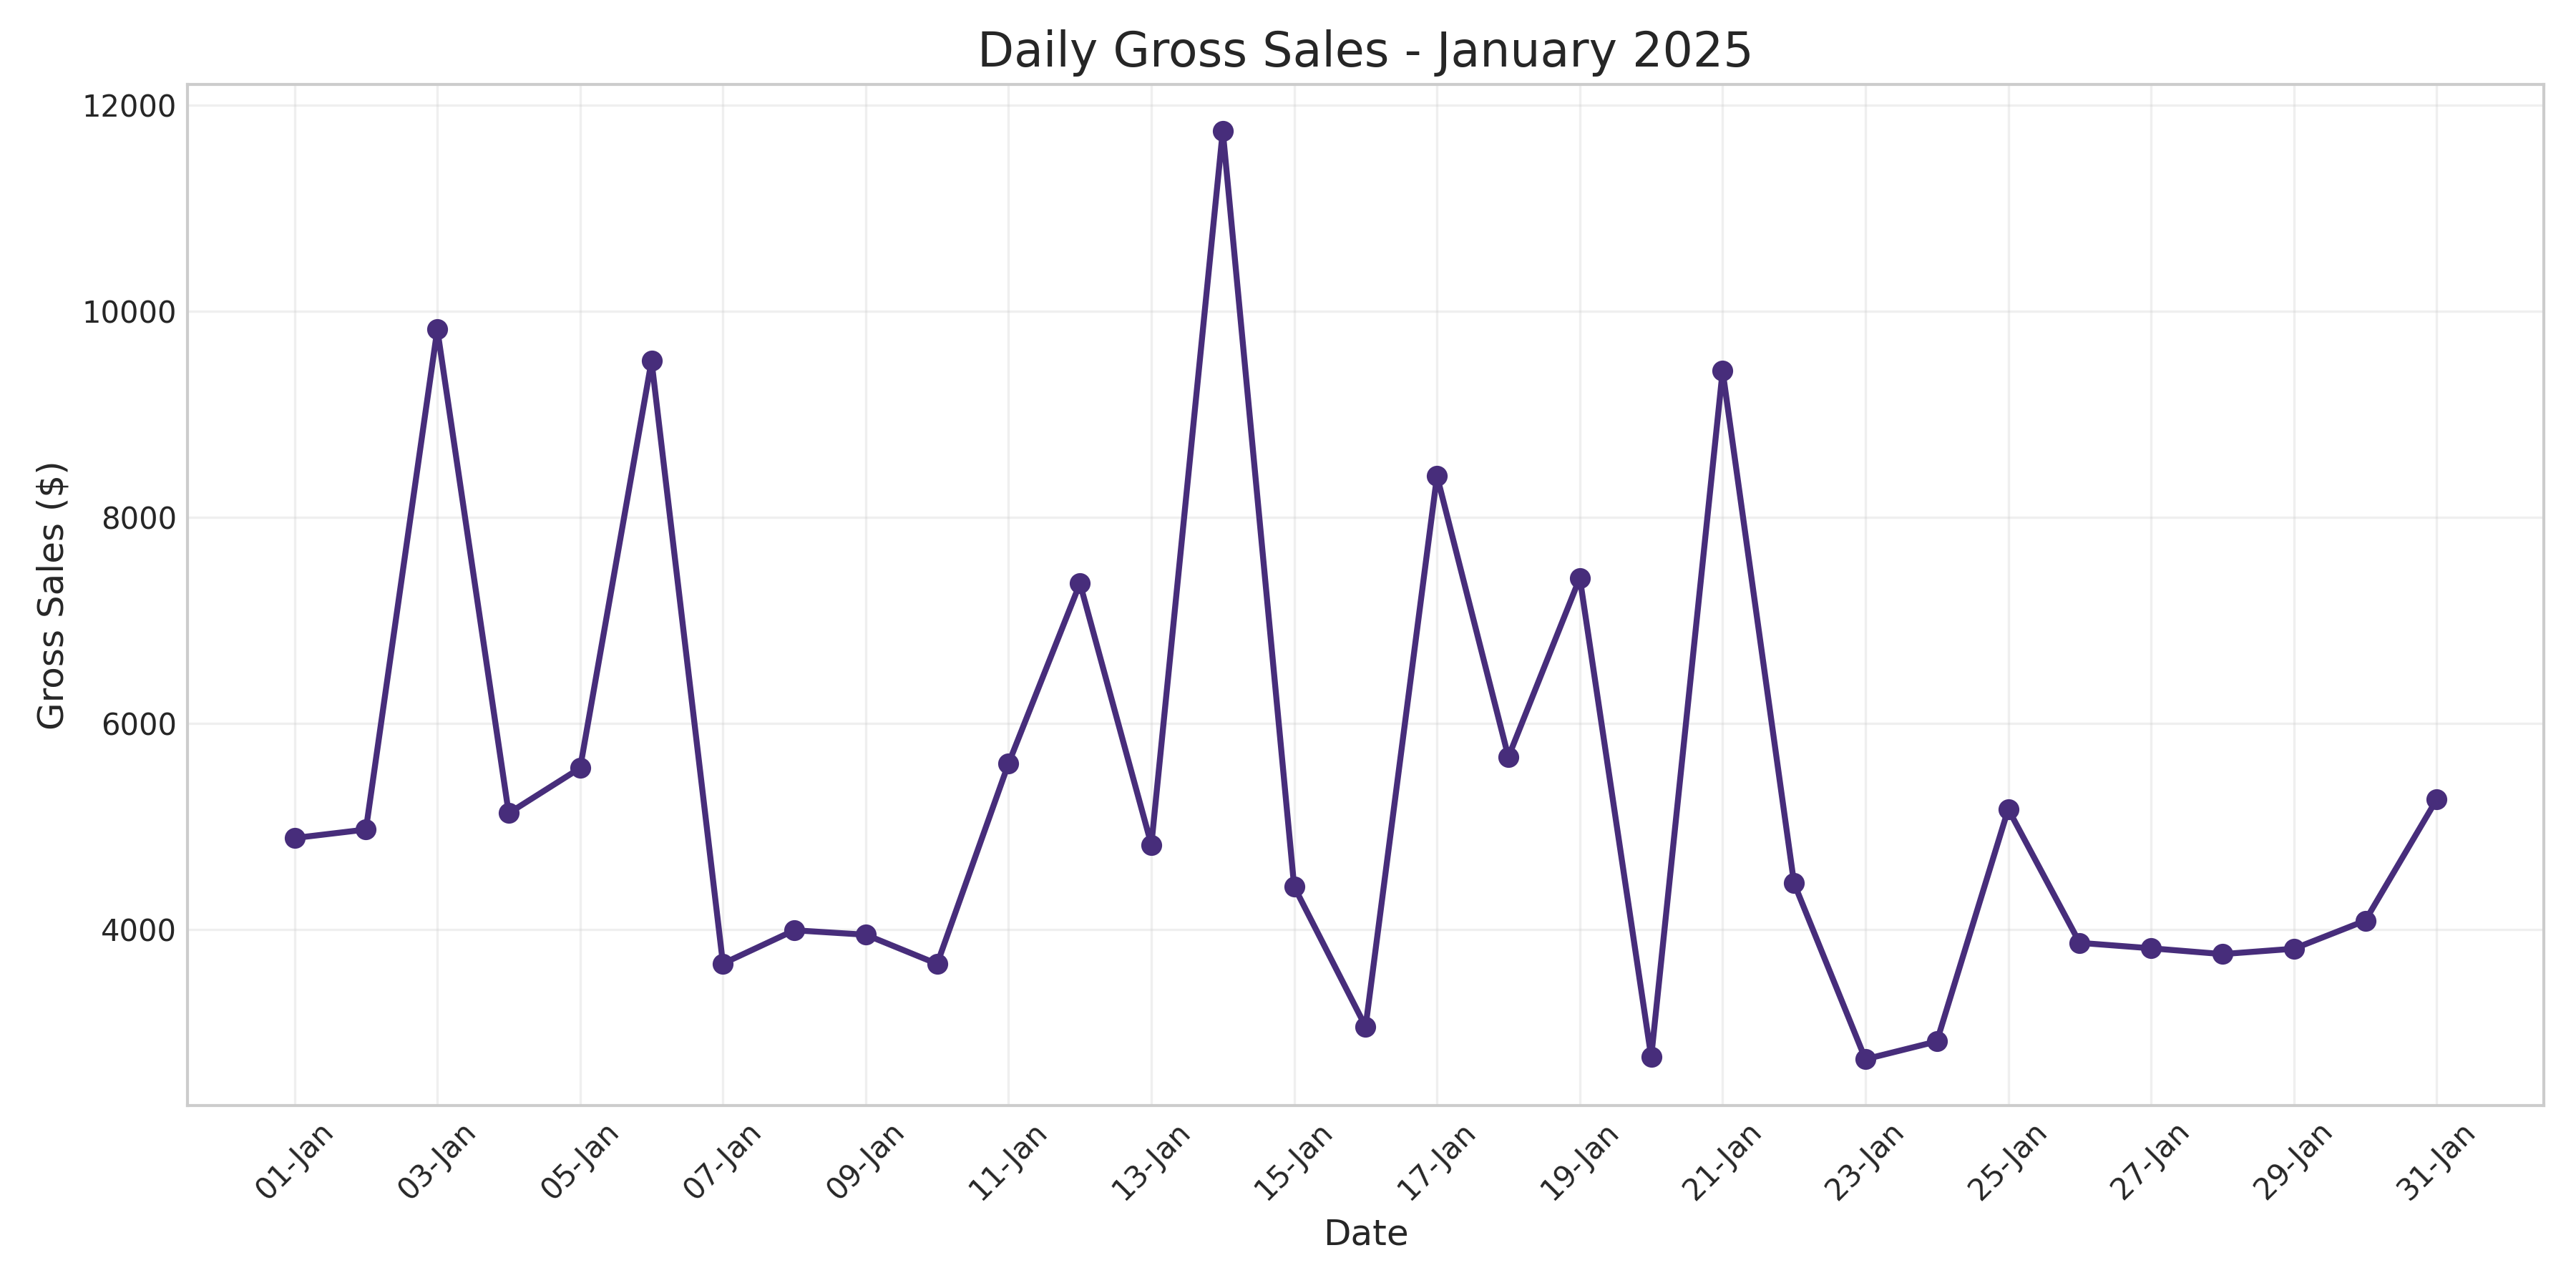
Daily gross sales fluctuated throughout January, with notable peaks on January 3rd, 6th, 14th, 17th, and 21st.
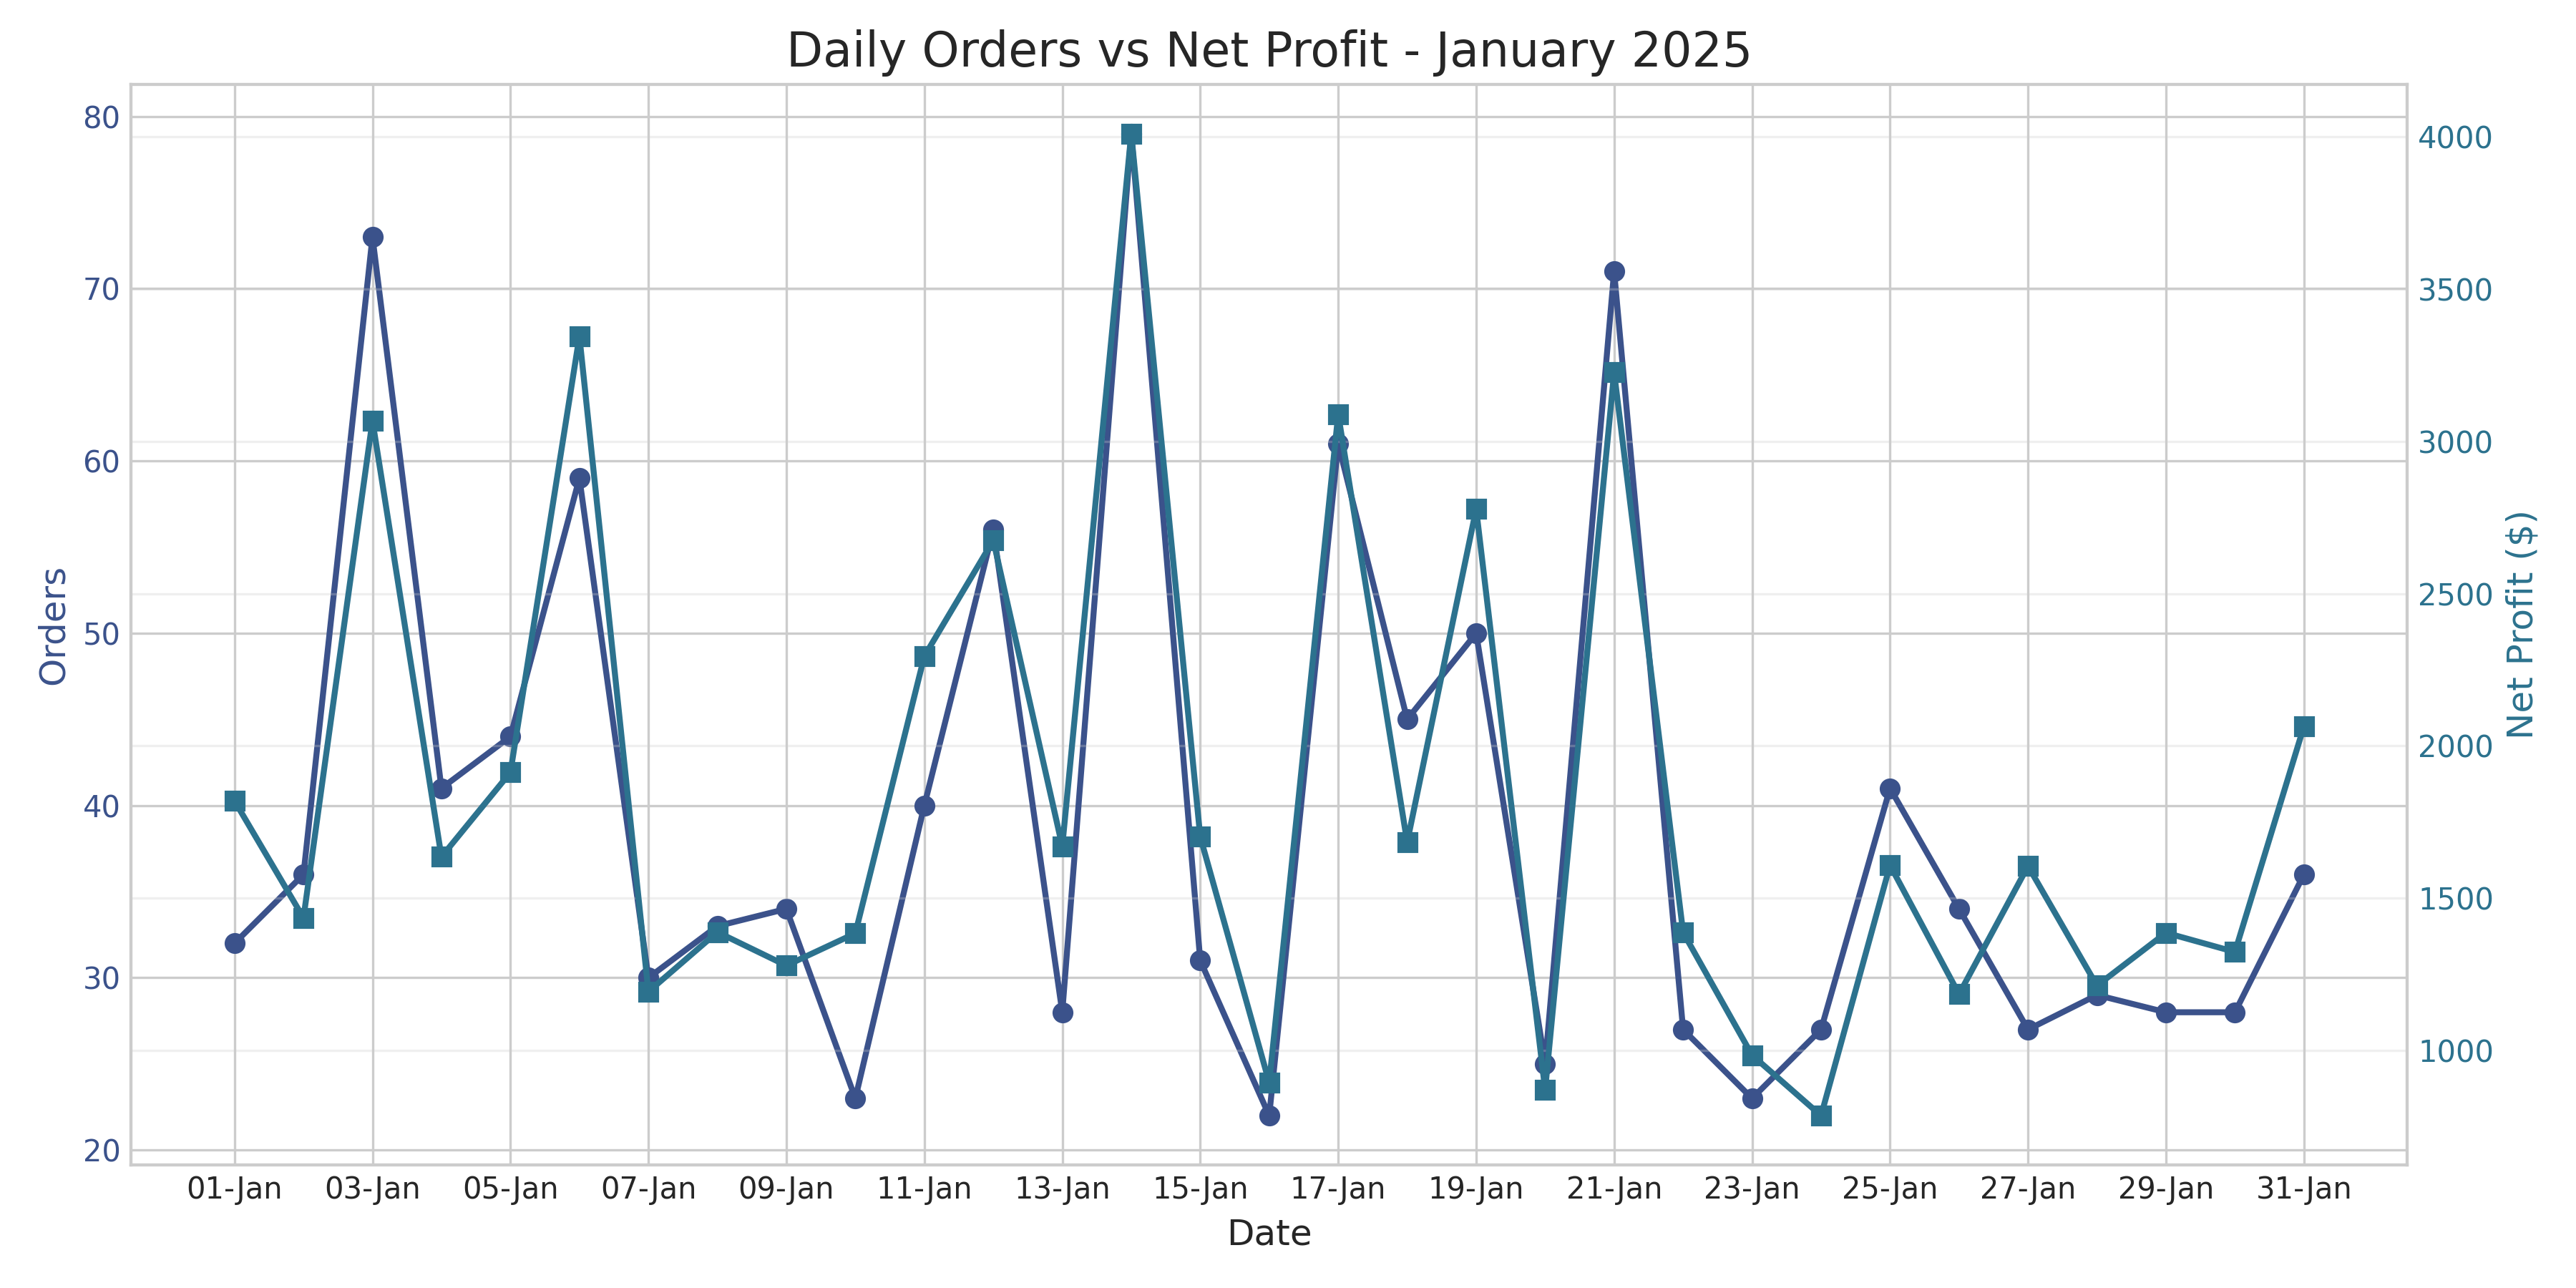
There is a strong correlation between the number of orders and net profit, with some days showing higher profit efficiency.
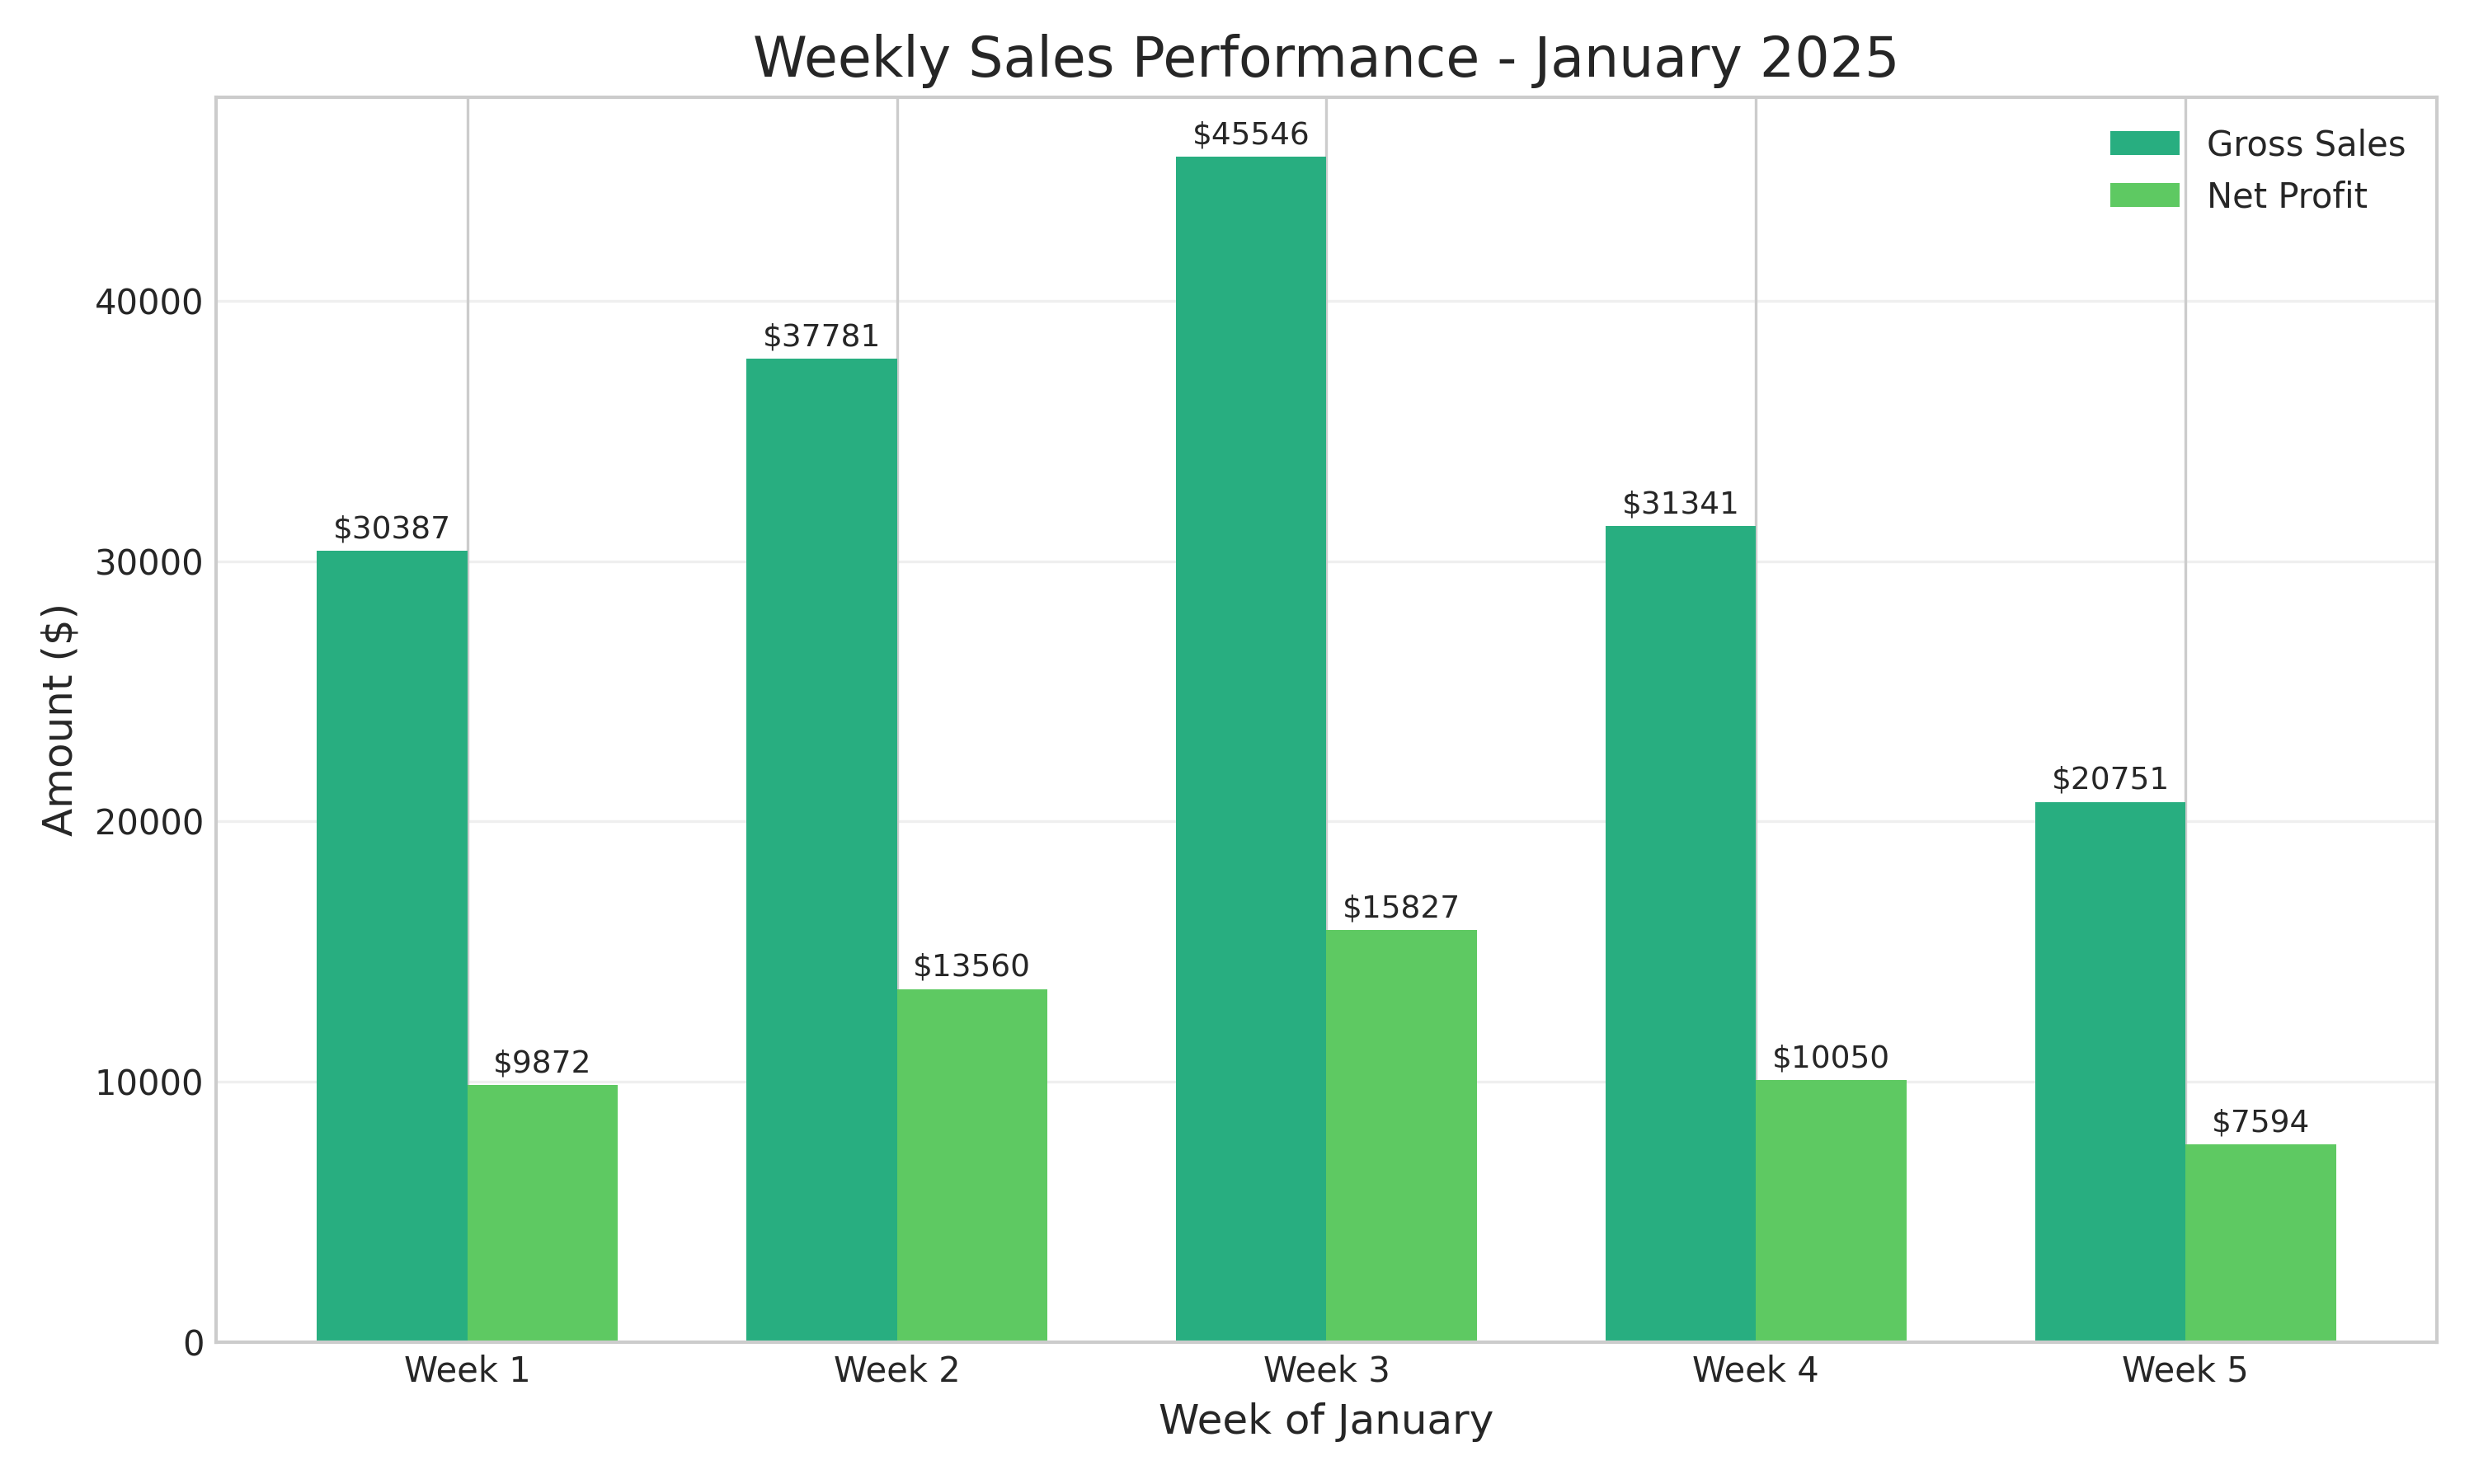
Week-by-week analysis shows consistent performance with slight variations, indicating stable business operations.
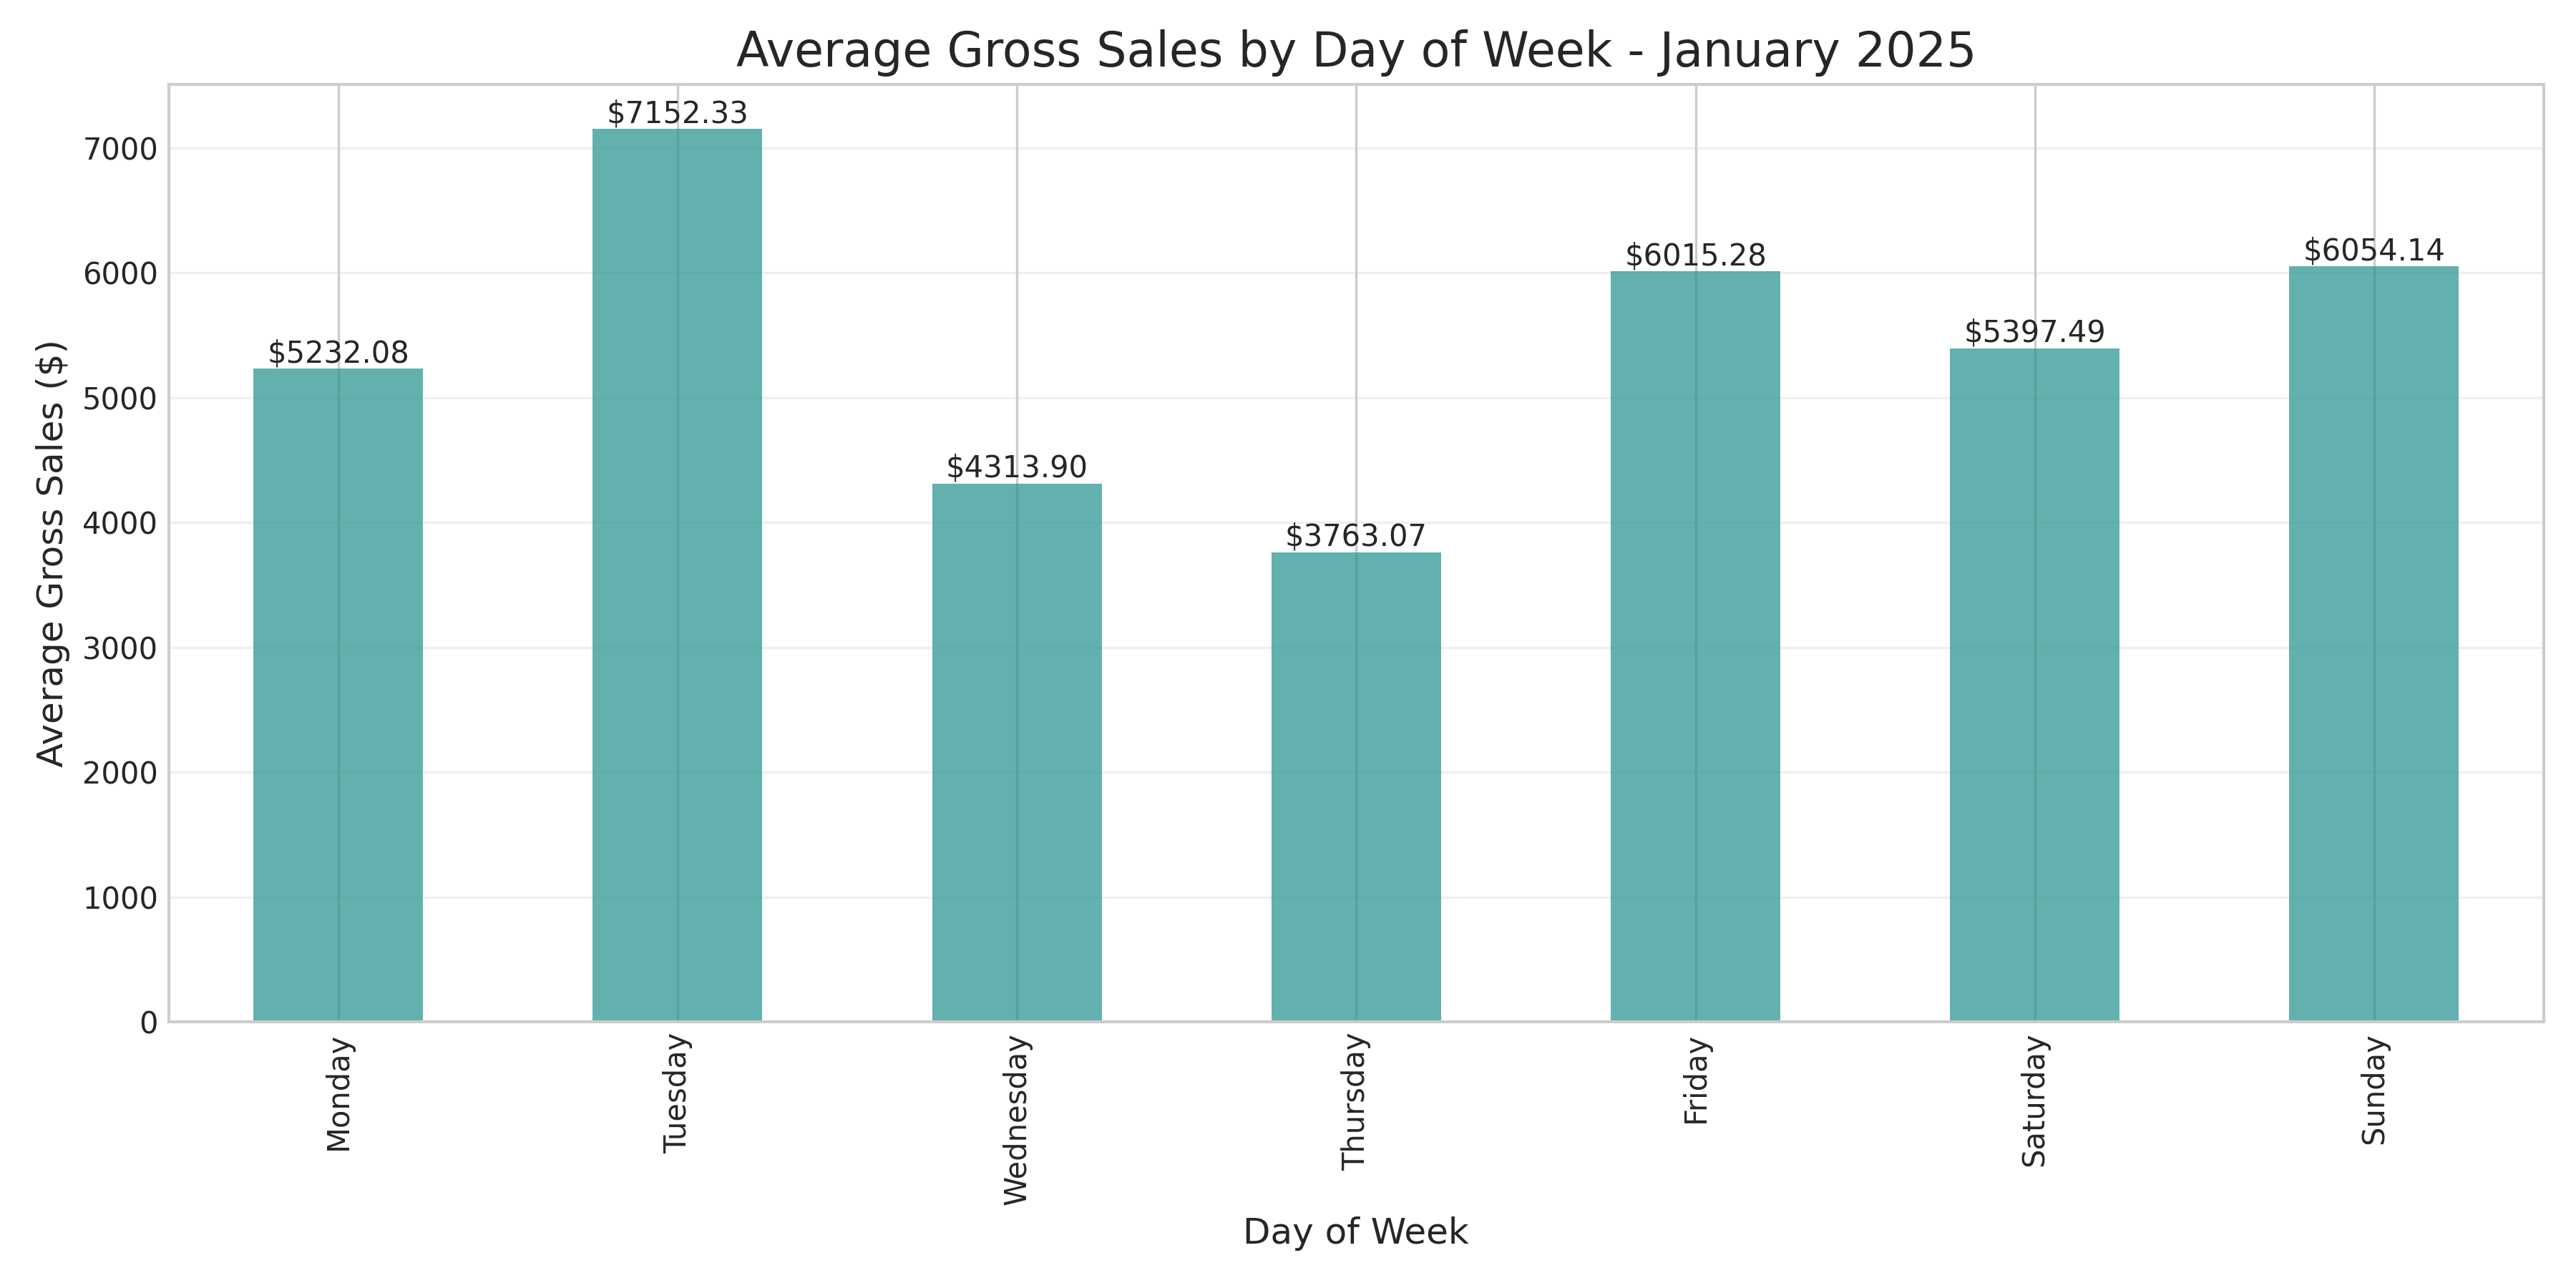
Friday and Tuesday show the highest average gross sales, while Sunday and Monday have the lowest performance.
The data reveals clear day-of-week patterns that can be leveraged for strategic planning:
These patterns suggest opportunities for day-specific promotional strategies to boost sales on underperforming days and maximize revenue on high-performing days.
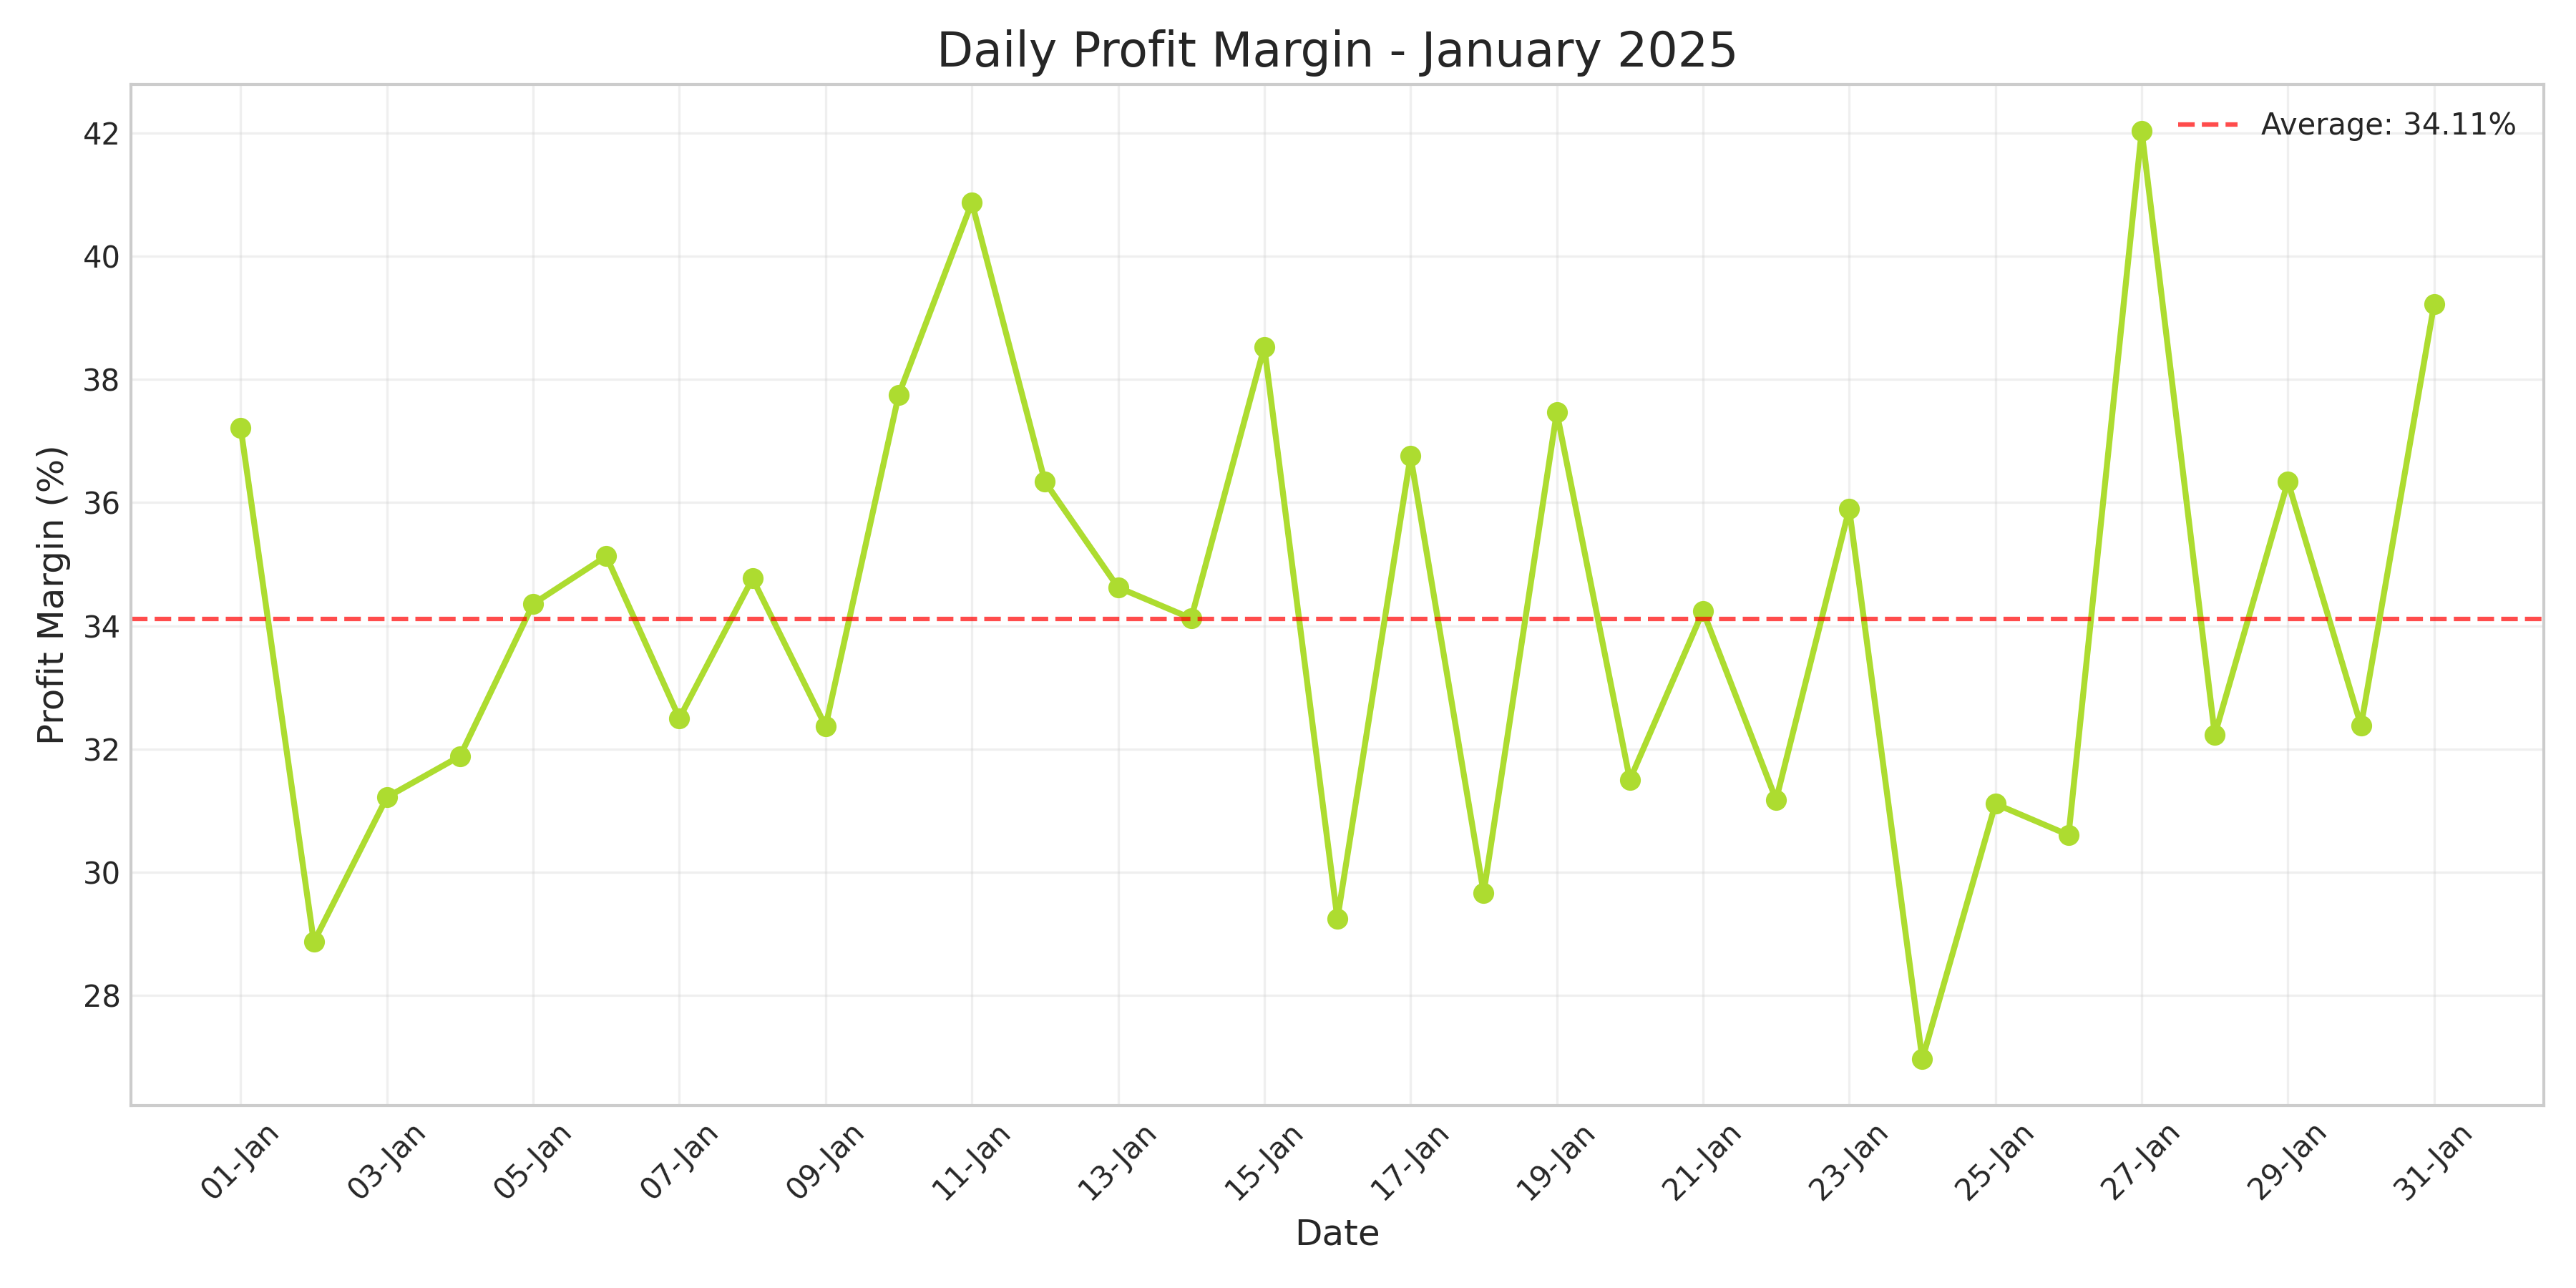
Profit margins fluctuated between 28% and 40% throughout January, with an average of 34.1%.
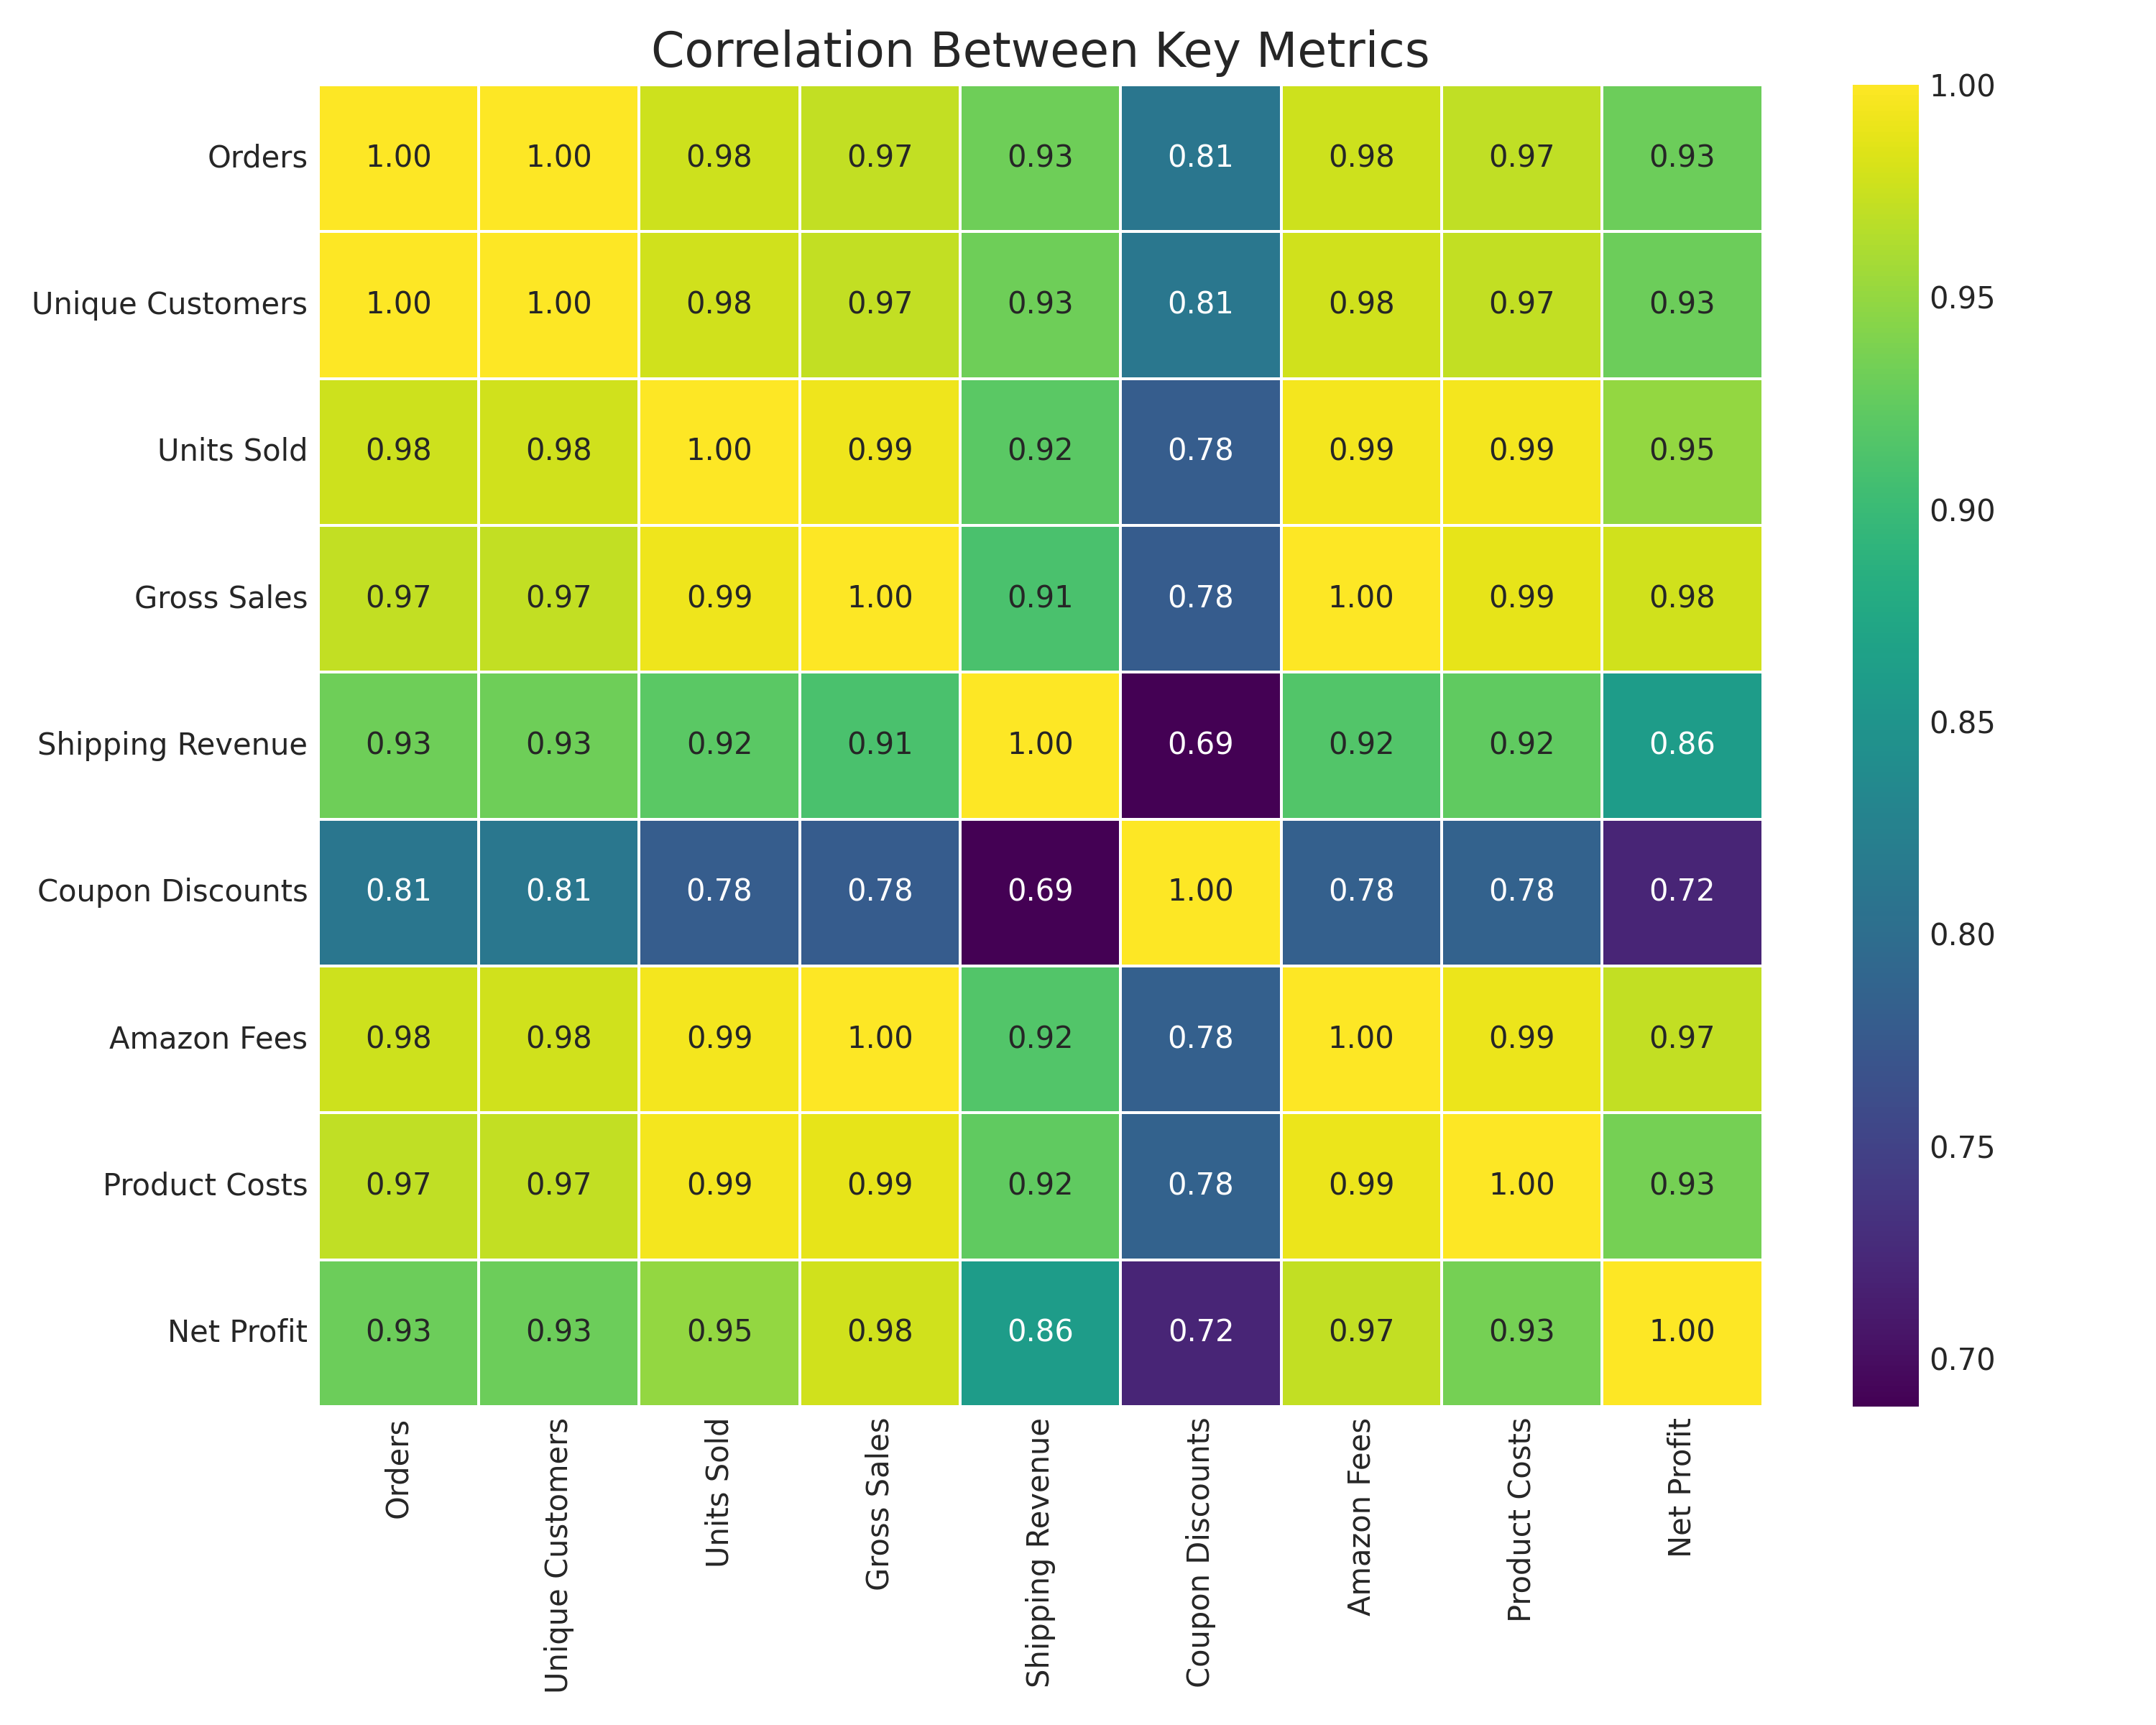
Strong positive correlations exist between orders, units sold, gross sales, and net profit, indicating consistent operational efficiency.
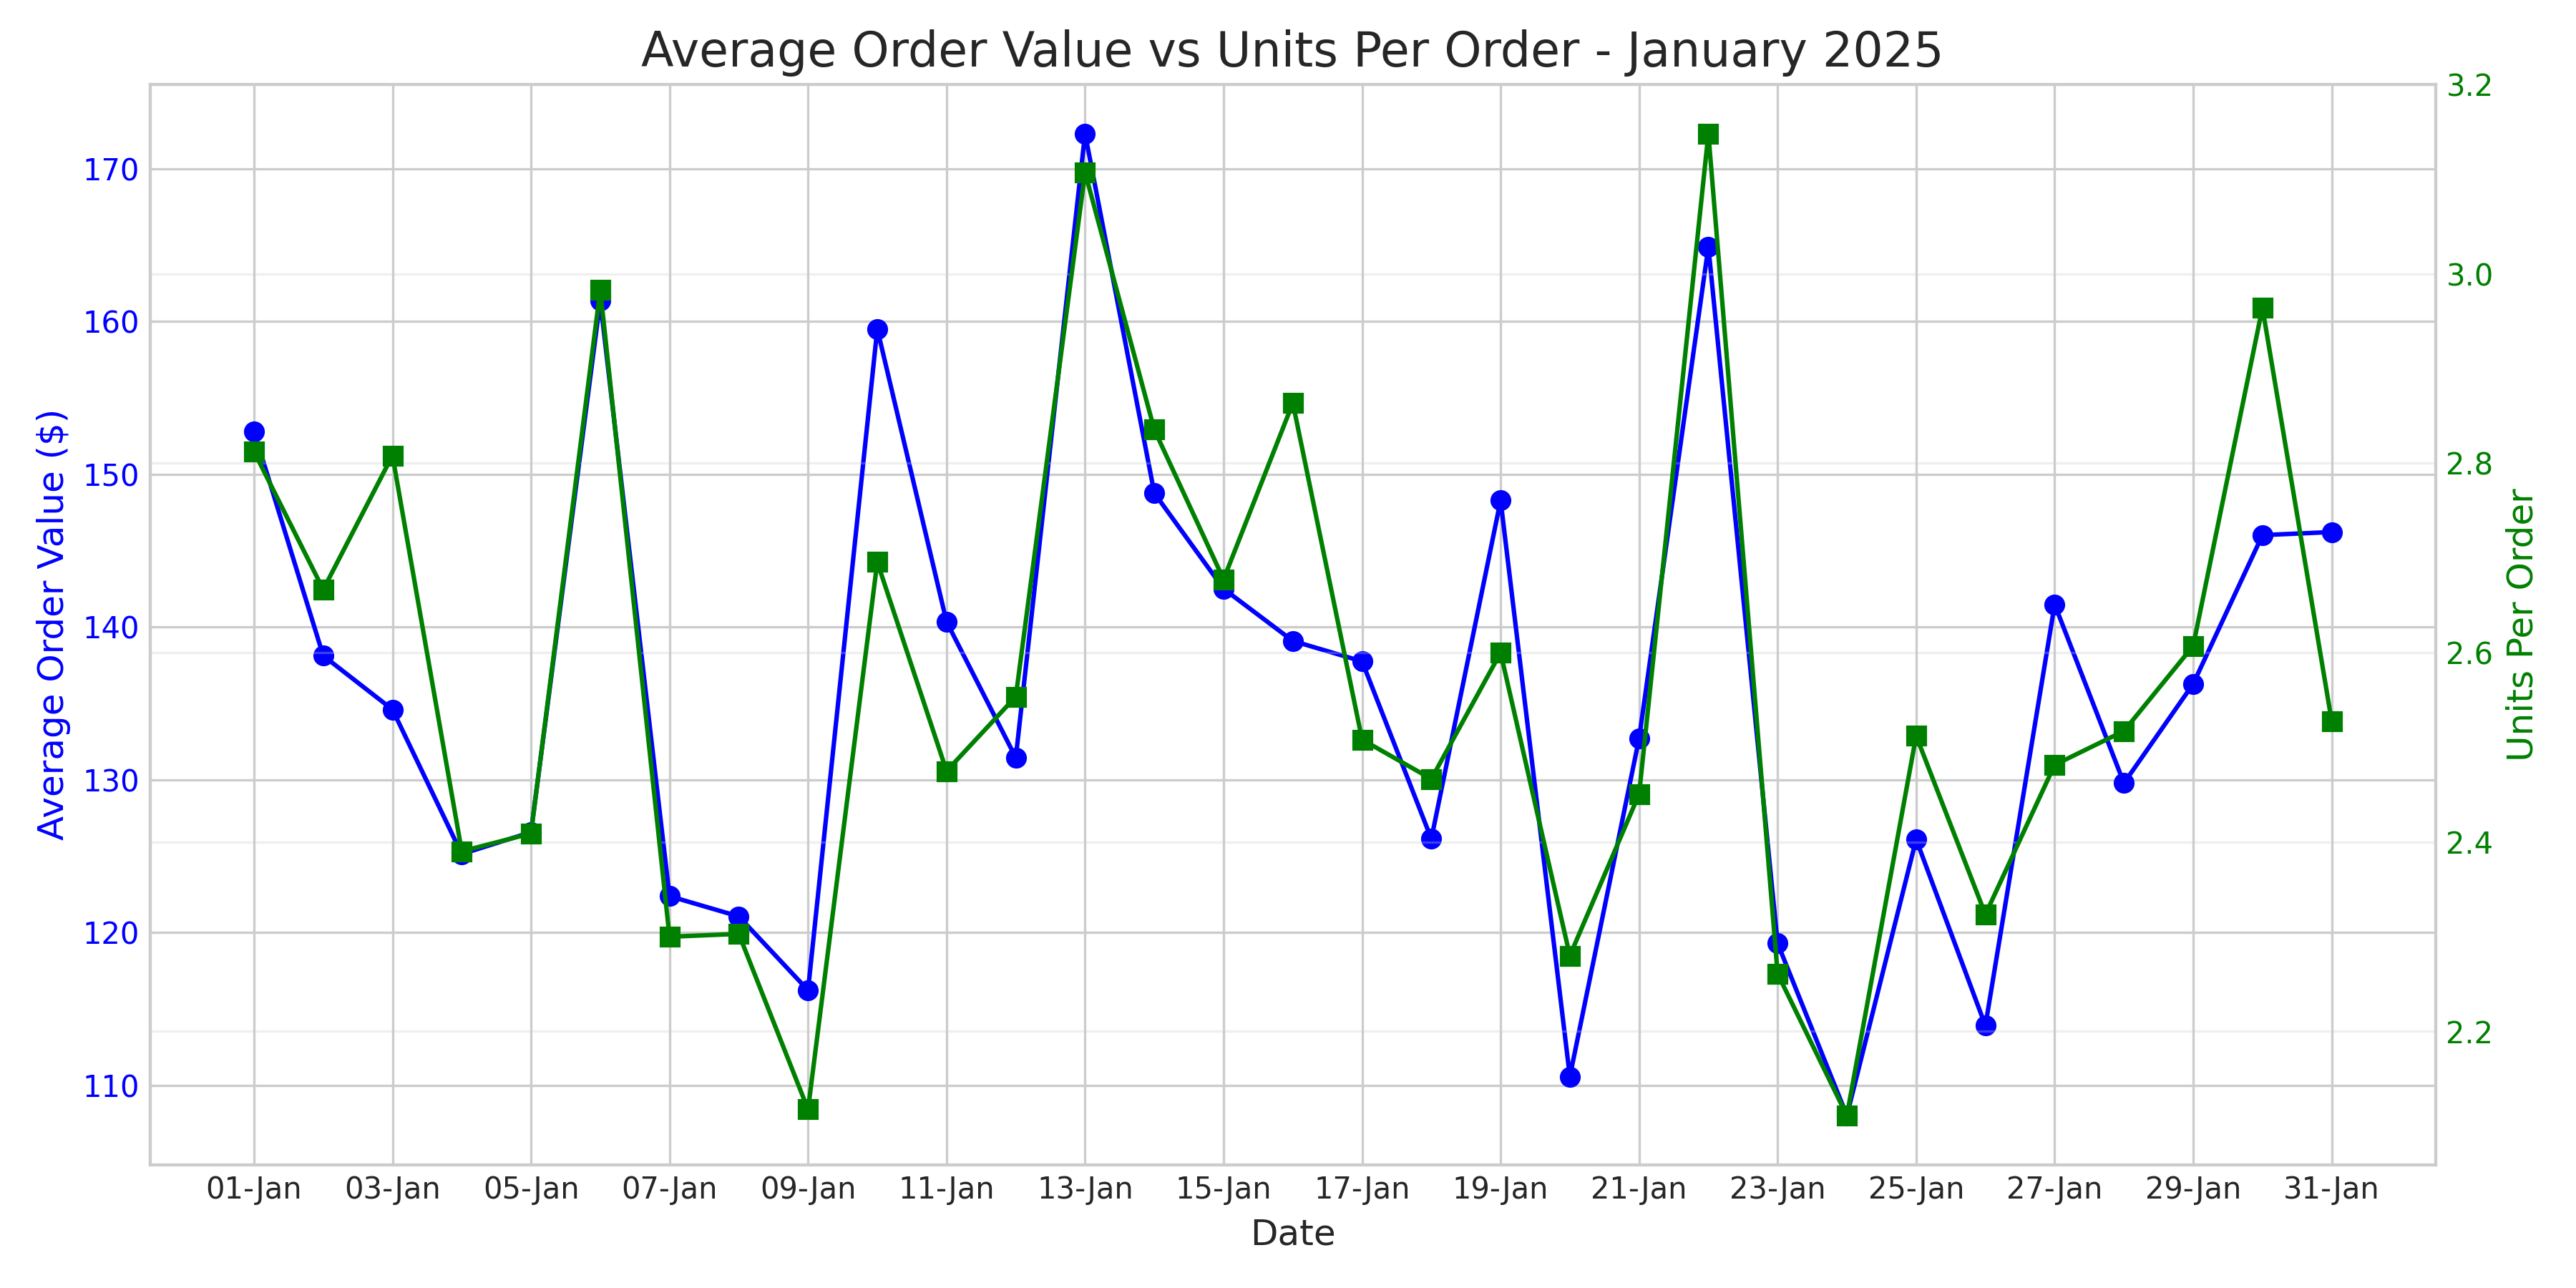
Average Order Value (AOV) fluctuated between $125 and $152, while Units Per Order remained relatively stable.
The data shows a consistent pattern of customer behavior with minimal variation in units per order. This suggests that customers have established purchasing habits that could be influenced through strategic promotions to increase basket size.
Goal: Increase February 2025 sales by 10% compared to January 2025
Current Sales: $165805.39 | Target Increase: $16580.54
Prioritize marketing and inventory investment in the highest-margin categories to maximize profitability while achieving sales growth.
Adjust pricing strategies based on price elasticity analysis to maximize revenue while remaining competitive.
Implement personalized marketing strategies for different customer segments to maximize customer lifetime value.
Implement a more strategic coupon campaign to drive sales while maintaining profitability.
Capitalize on the Valentine's Day opportunity with targeted promotions and curated collections.
| Week | Focus Area | Key Actions |
|---|---|---|
| Week 1 (Feb 1-7) | Day-Specific Promotions & Valentine's Early Bird | Launch Sunday-Monday specials; Begin Valentine's promotions |
| Week 2 (Feb 8-14) | Valentine's Day Peak & AOV Strategy | Implement tiered discounts; Feature Valentine's collections; Expedited shipping options |
| Week 3 (Feb 15-21) | Post-Valentine's Recovery & Category Optimization | Launch new category features; Implement cross-selling recommendations |
| Week 4 (Feb 22-28) | End-of-Month Push & Coupon Campaign | Deploy targeted coupons; End-of-month flash sales |
By implementing these strategic recommendations, we project achieving the 10% sales growth target for February 2025, increasing gross sales from $165805.39 to approximately $182,385.93, with a corresponding increase in net profit. The total expected impact of all recommendations is 12.0%.